Preflop Charts
Which hands to open, 3-bet and 4-bet from every seat at the table. Six-max and nine-max, cash and tournament. Nothing to install.
A preflop chart is the single fastest way to stop losing money before the flop. It tells you exactly which starting hands to raise, call or fold from each seat at a Texas Hold'em table, so the hardest decision in poker, the one you face every single hand, becomes automatic. The interactive chart below covers opening, 3-bet and 4-bet ranges for every position, in both 6-max and 9-max, for cash games and tournaments. Pick your table, game and seat, and the 13×13 grid fills in what a solid, GTO-based strategy plays. It is free, runs entirely in your browser, and there is nothing to install.
The diagonal running from AA to 22 is the pocket pairs. Everything above it is suited, everything below it is offsuit. The percentage counts actual card combinations out of all 1,326 possible starting hands, not squares on the grid, which is why a chart that looks half-full is usually well under half your hands.
Want these ranges on paper? Get the free printable cheat sheet: every position on one page, ready to print or download as a PDF. Get the cheat sheet →Preflop charts to download
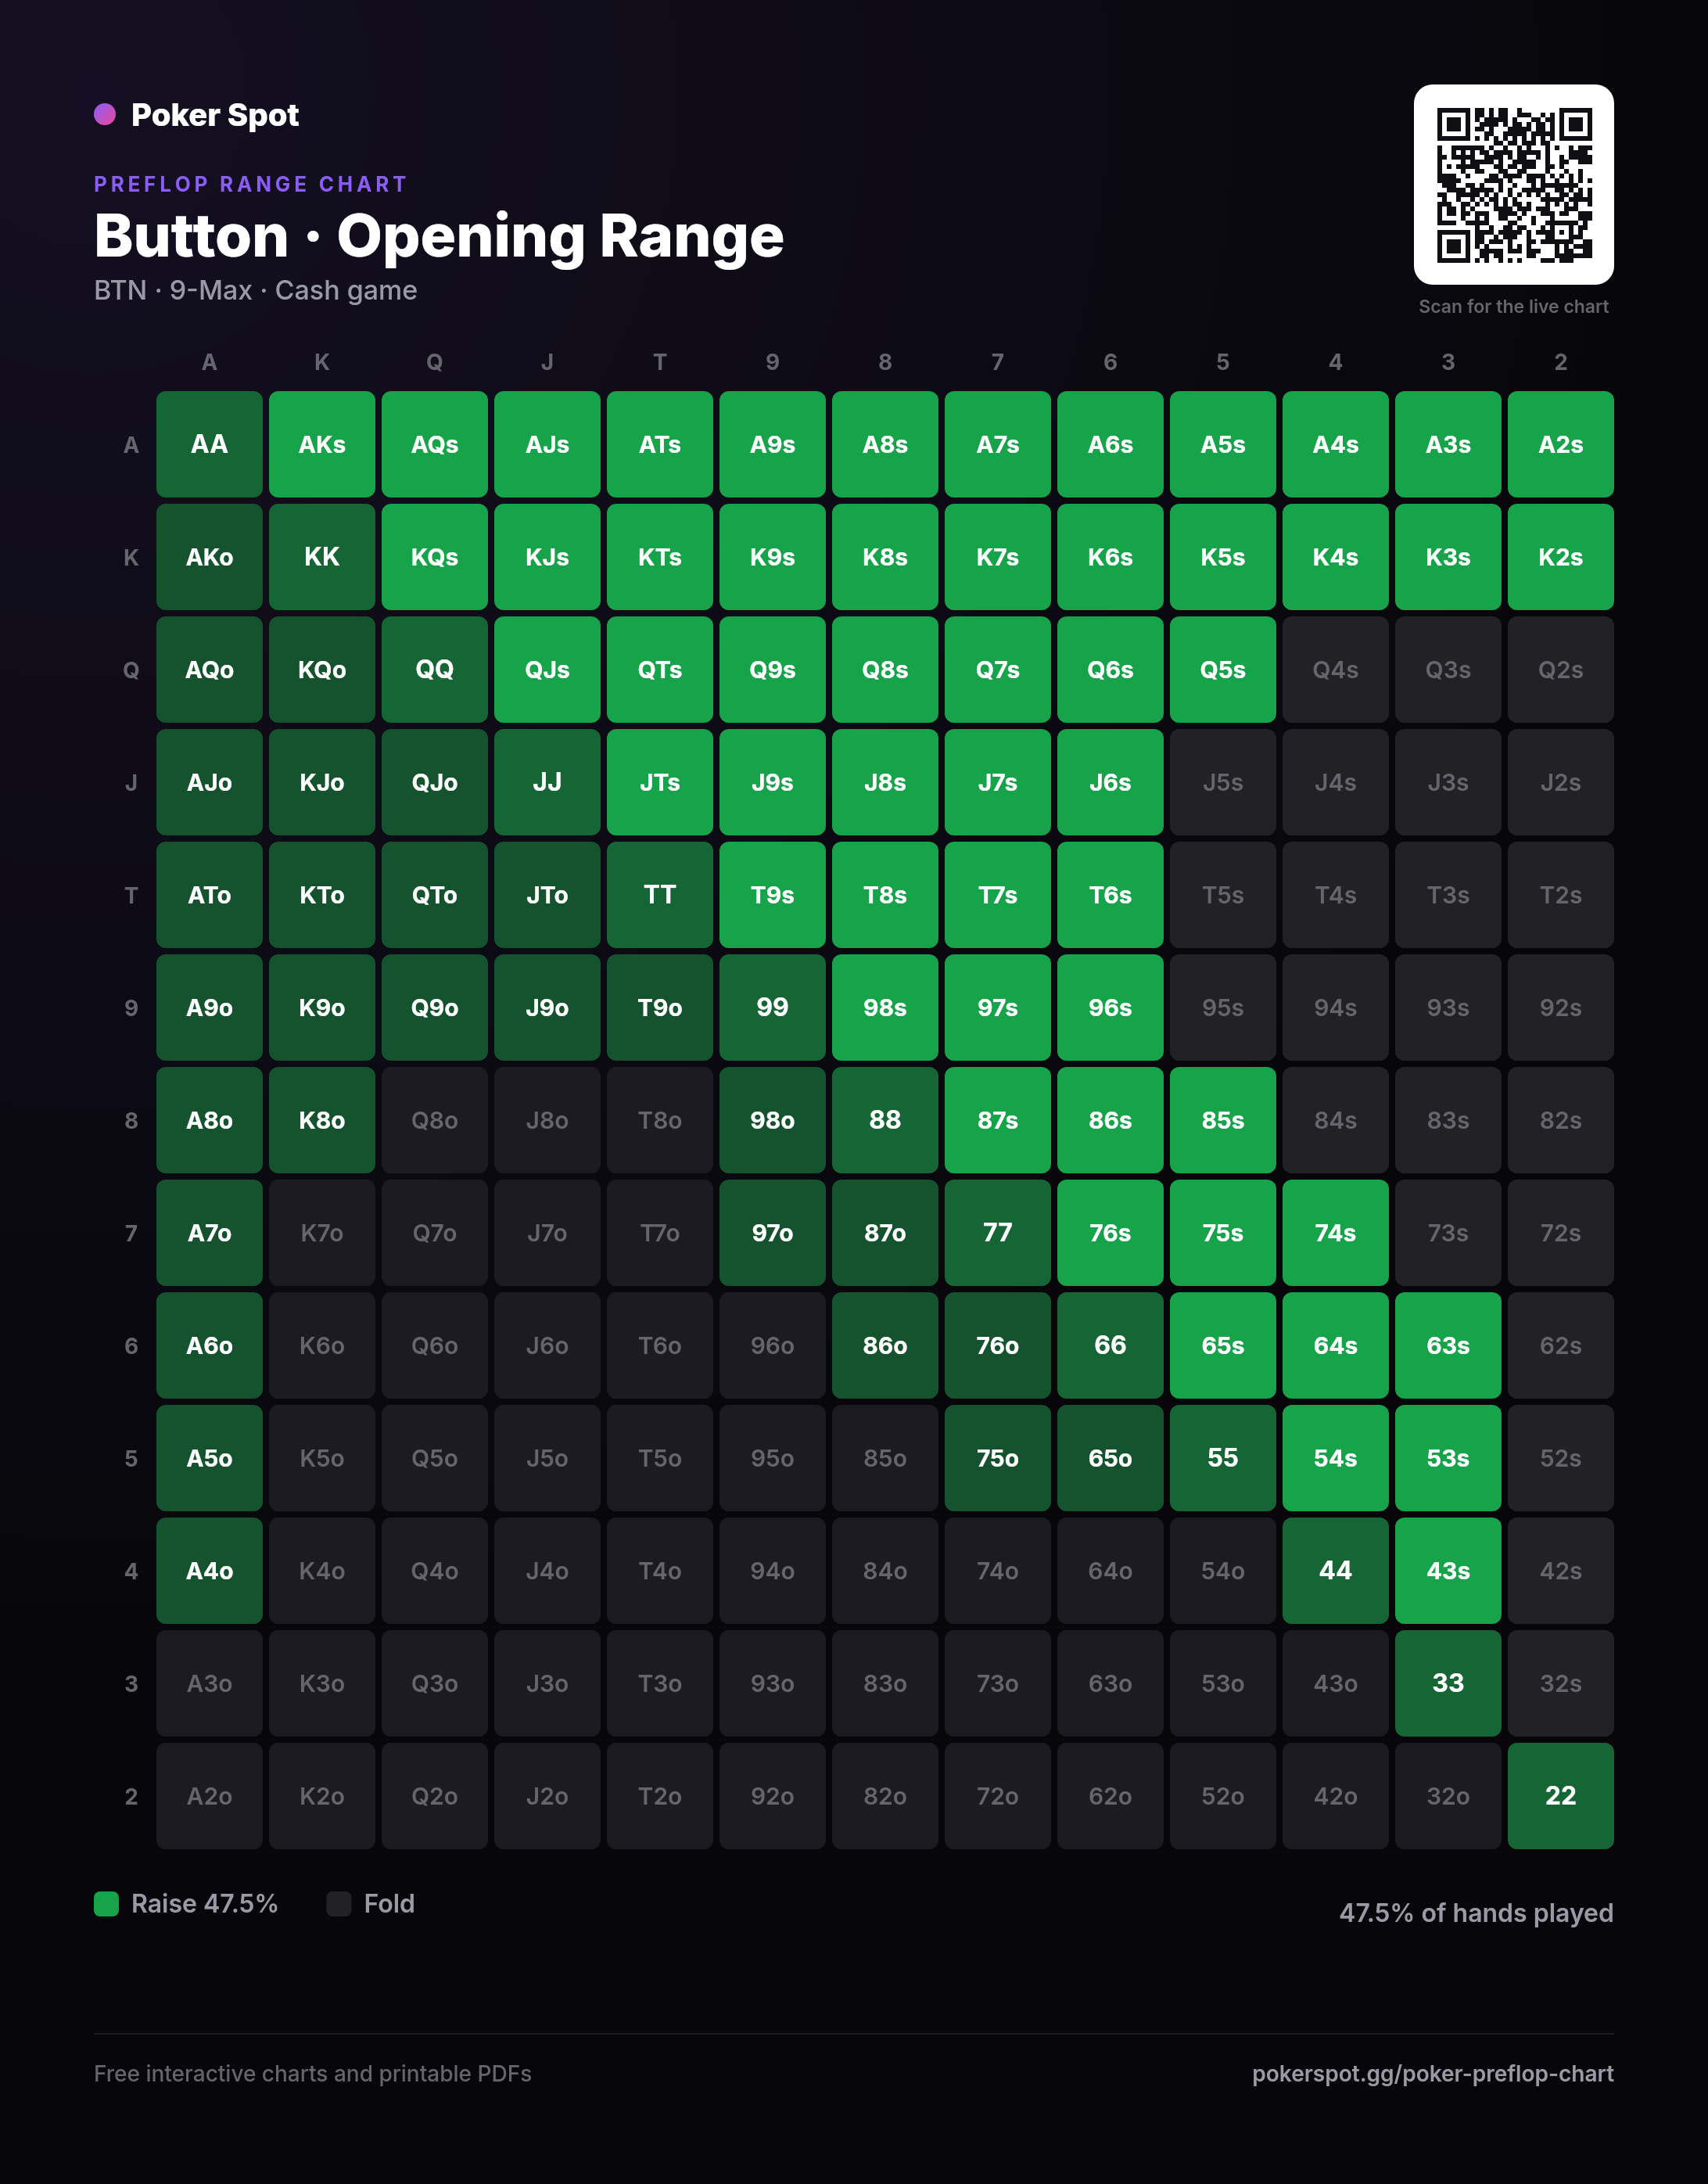
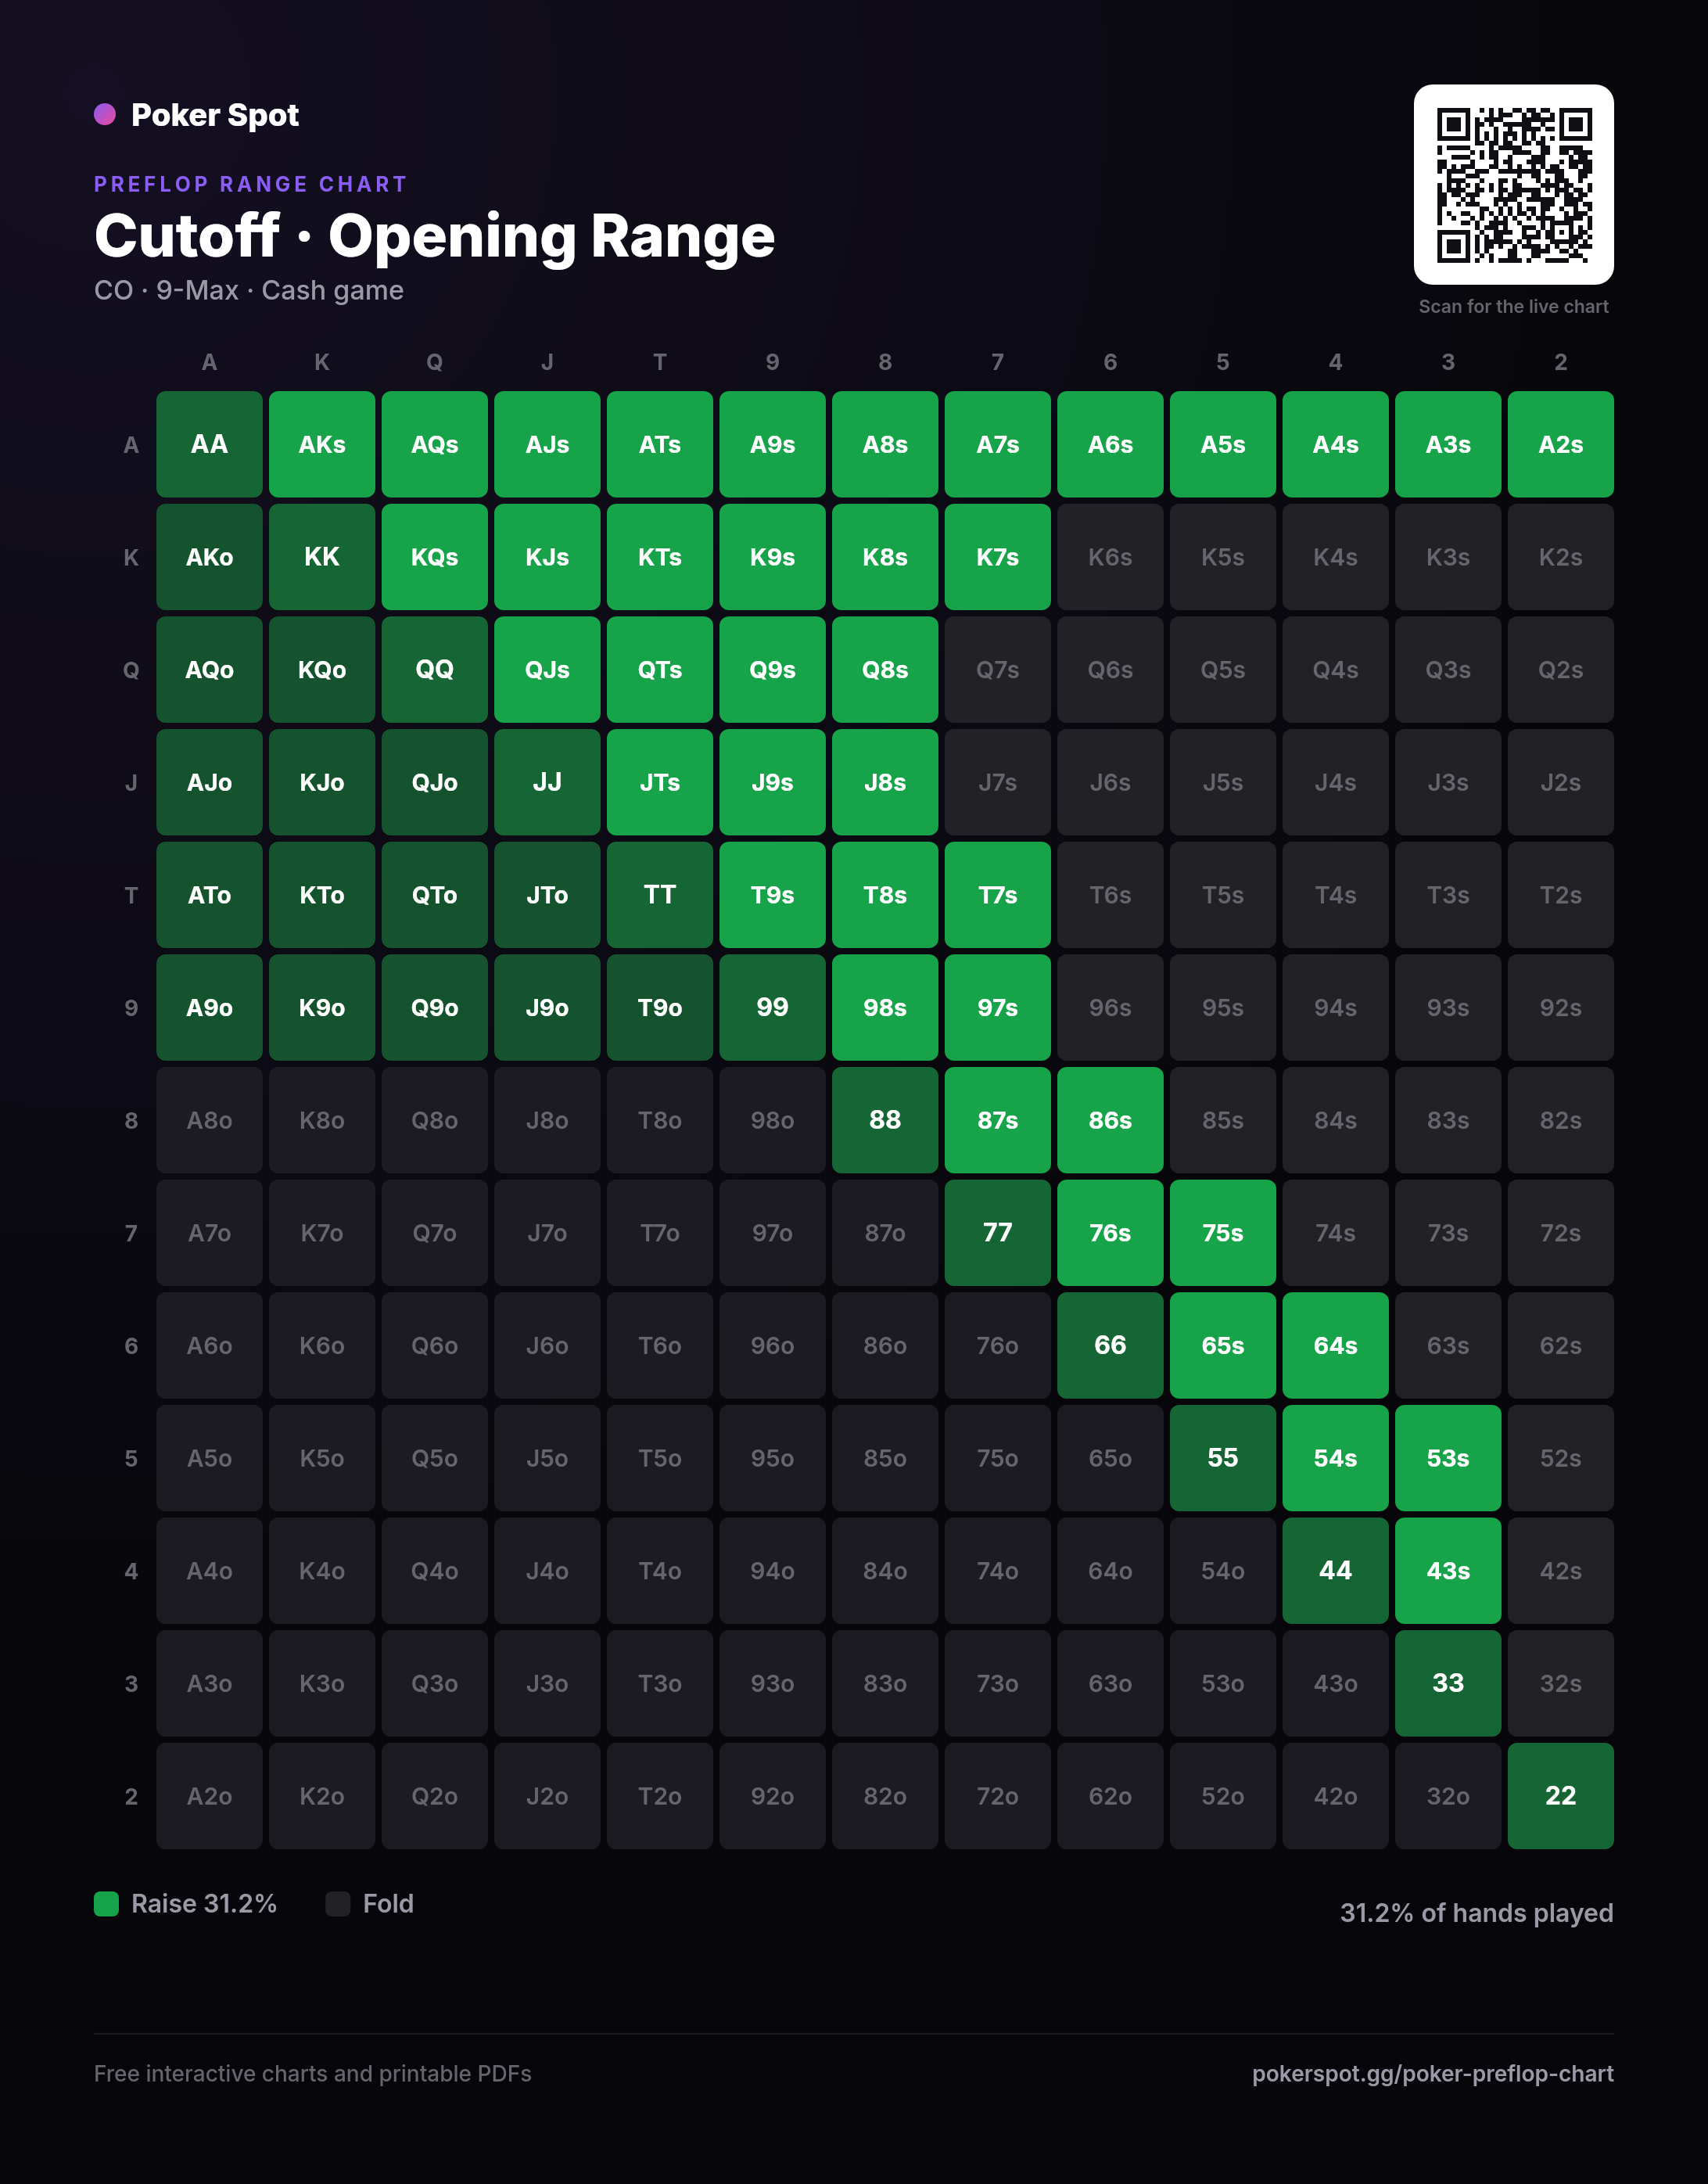
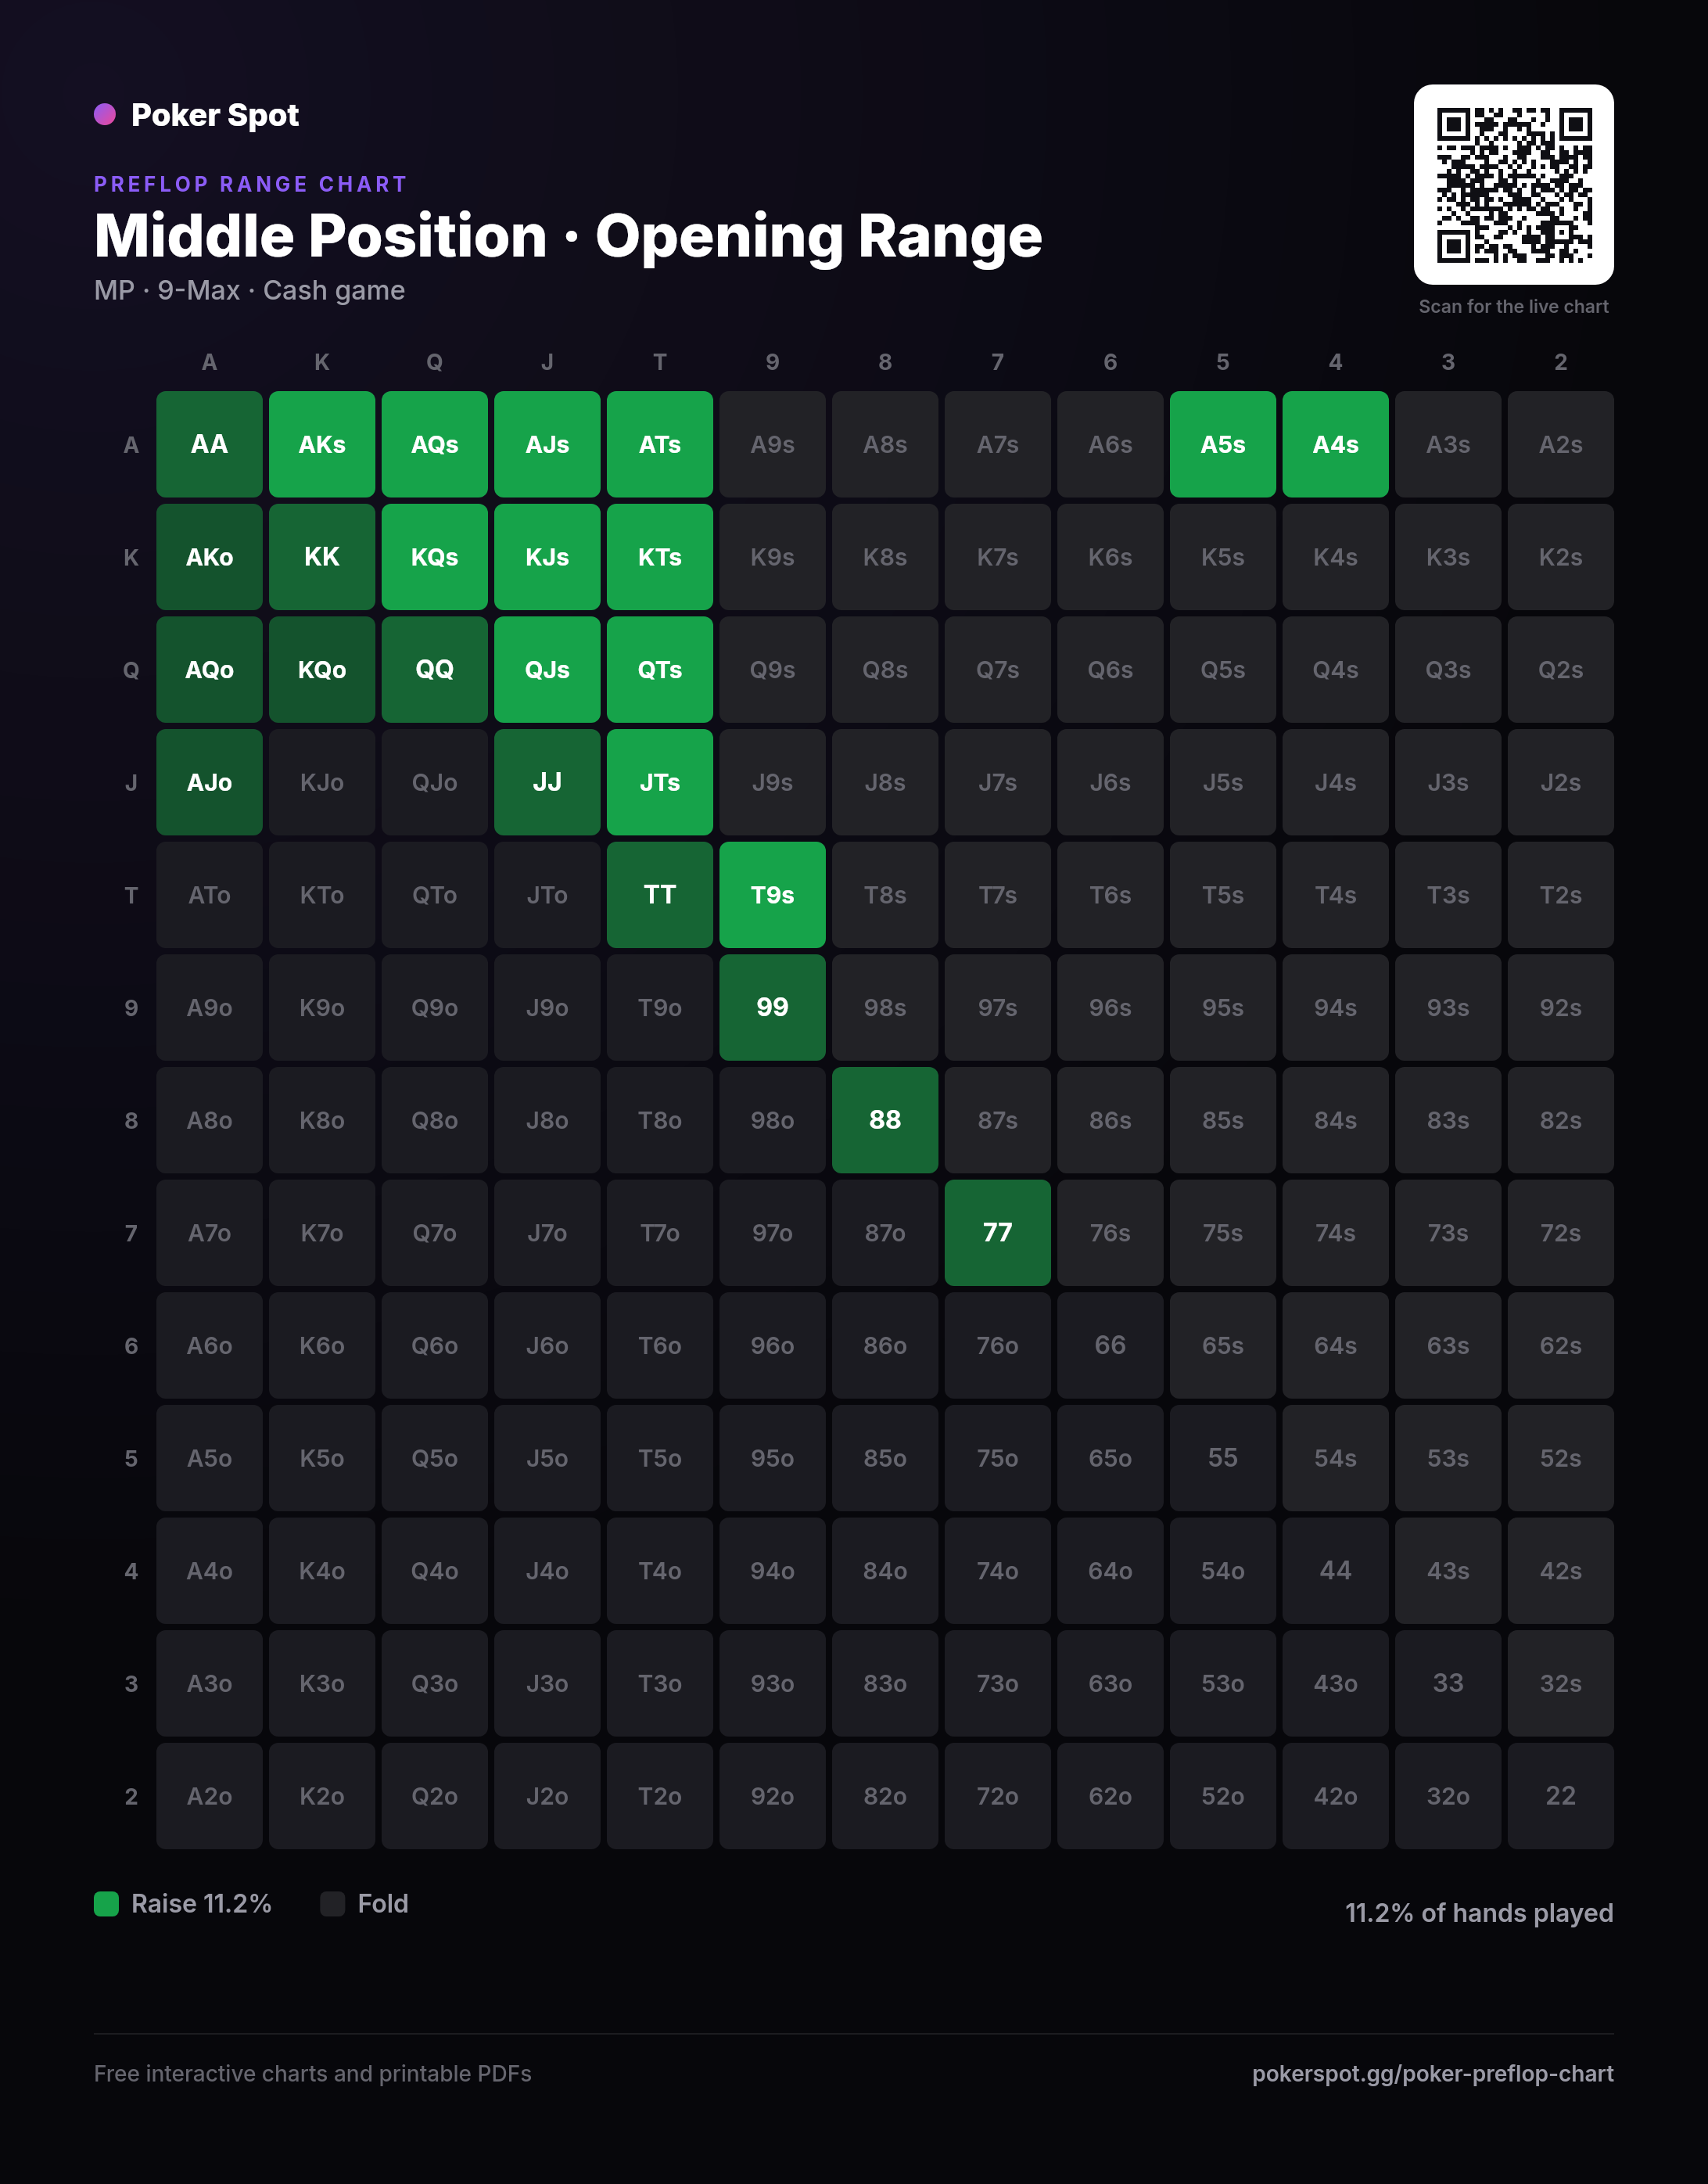
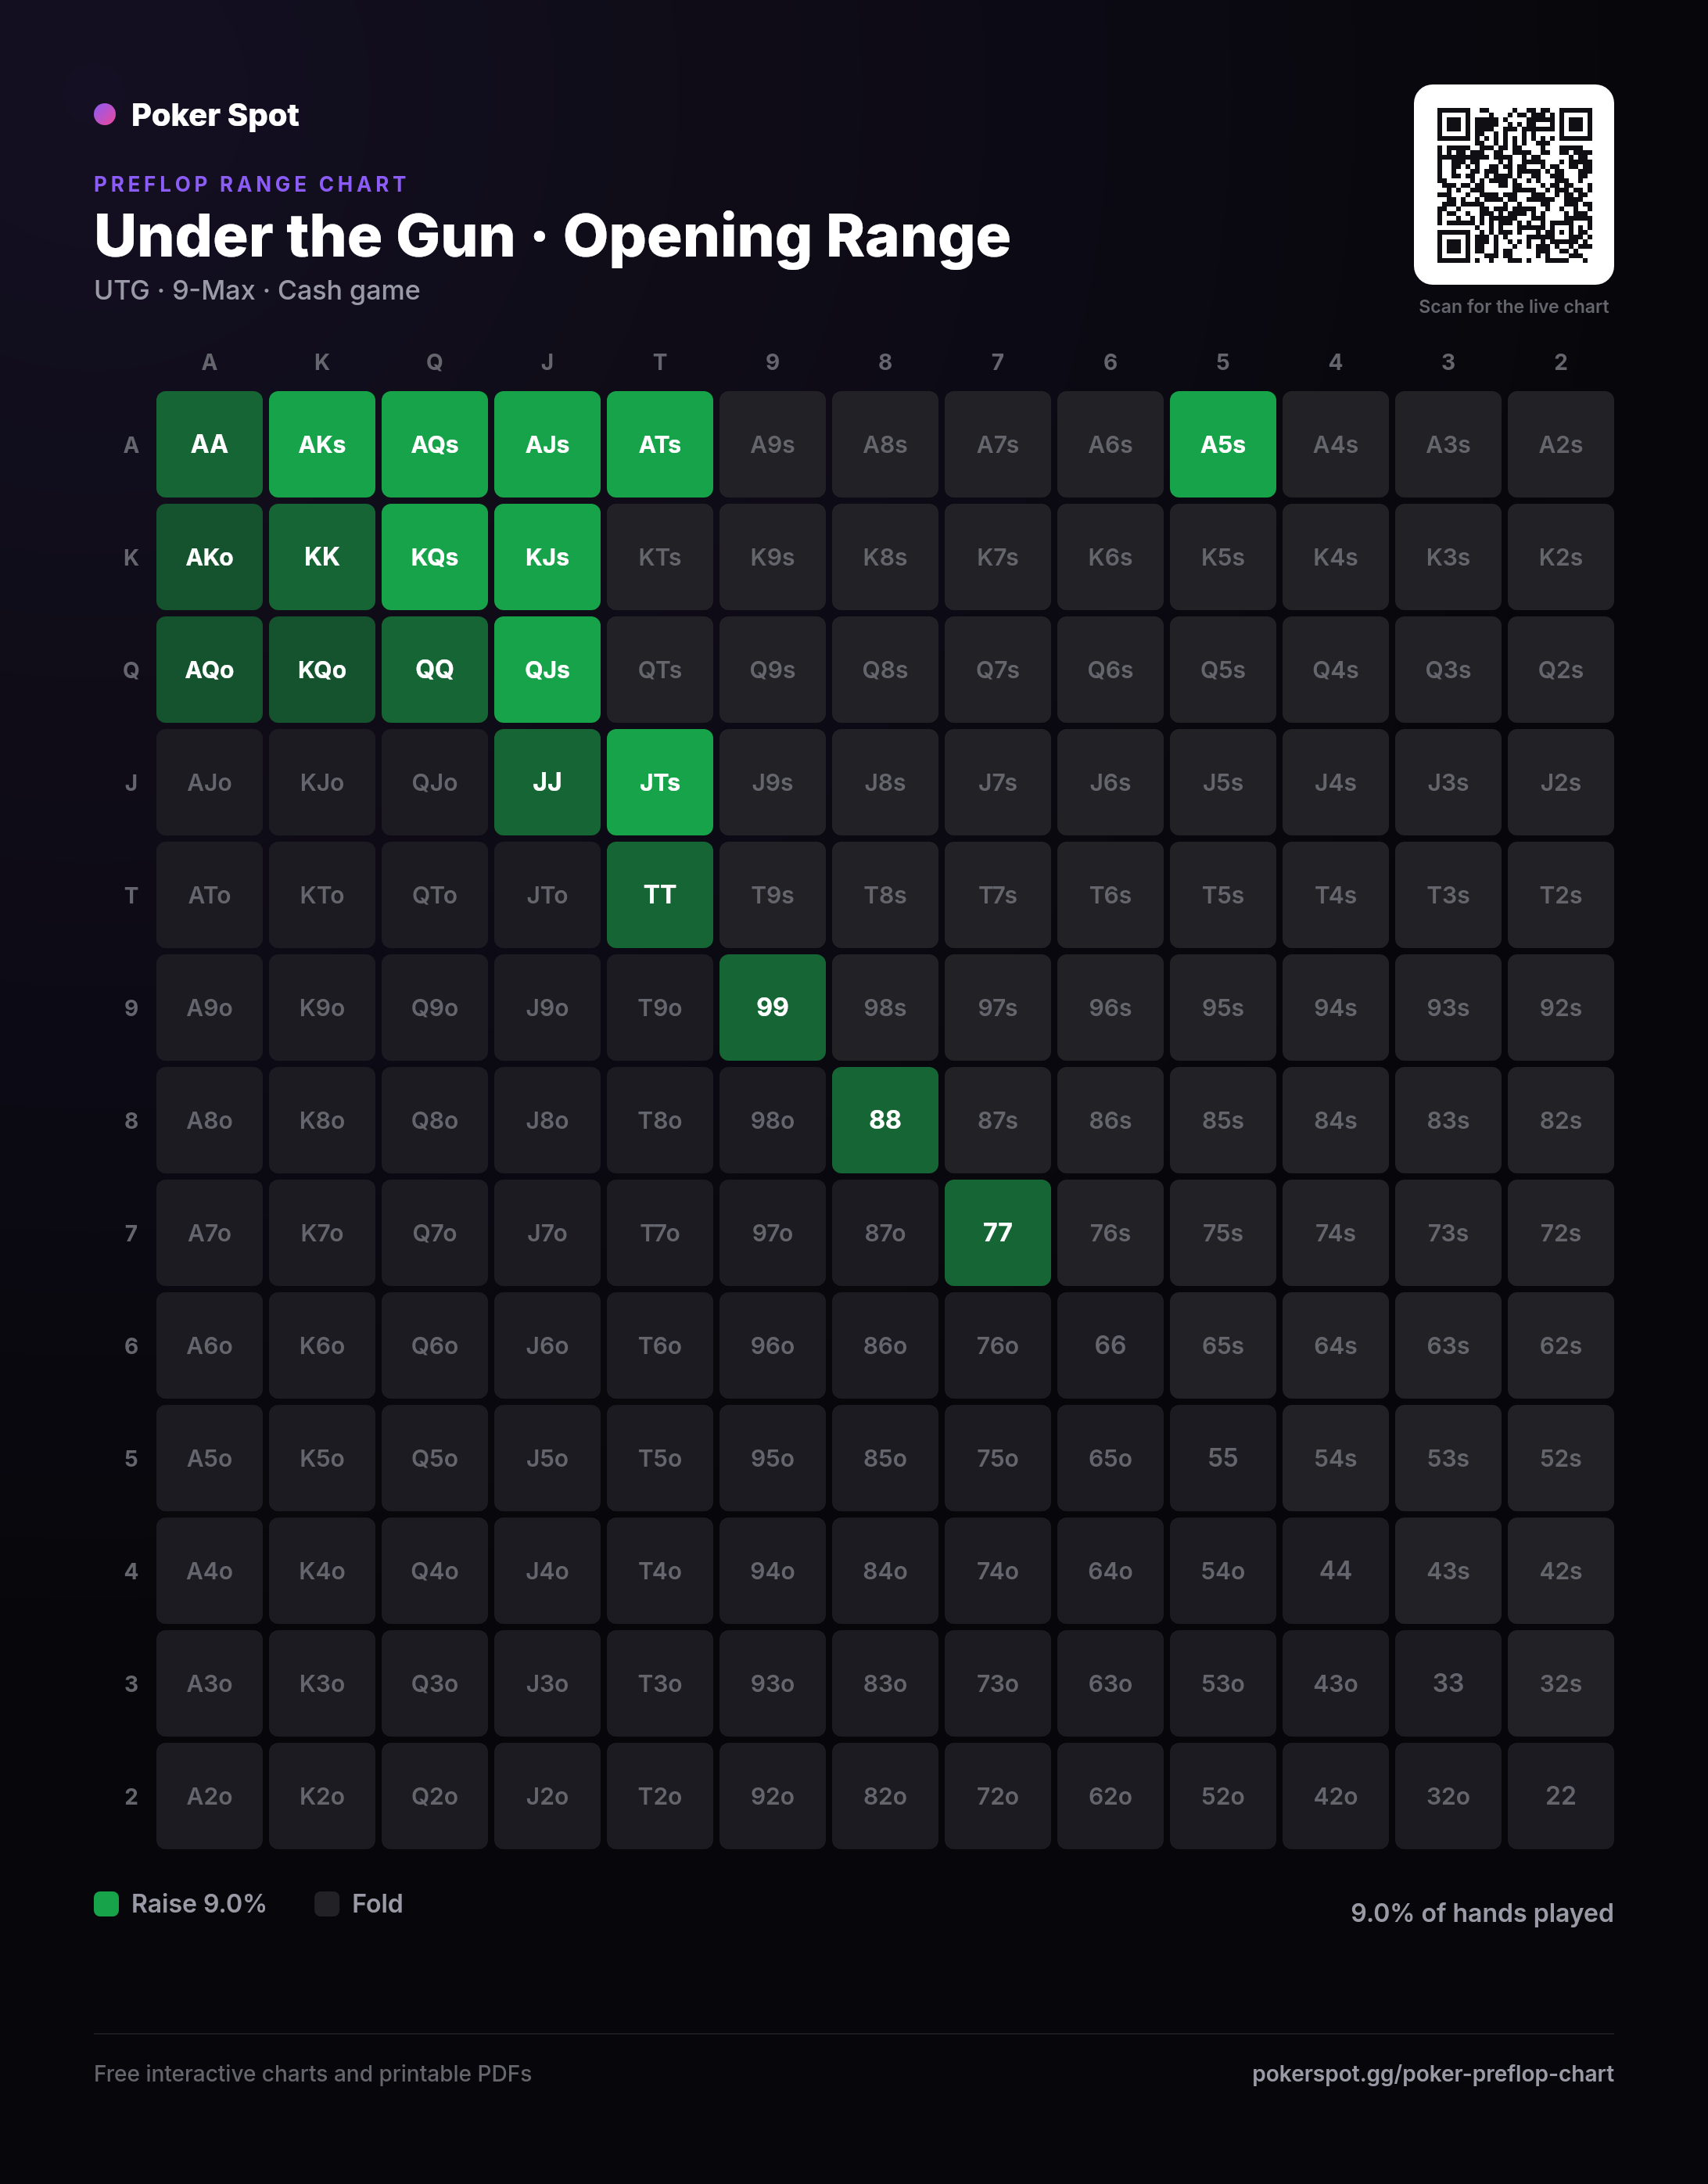
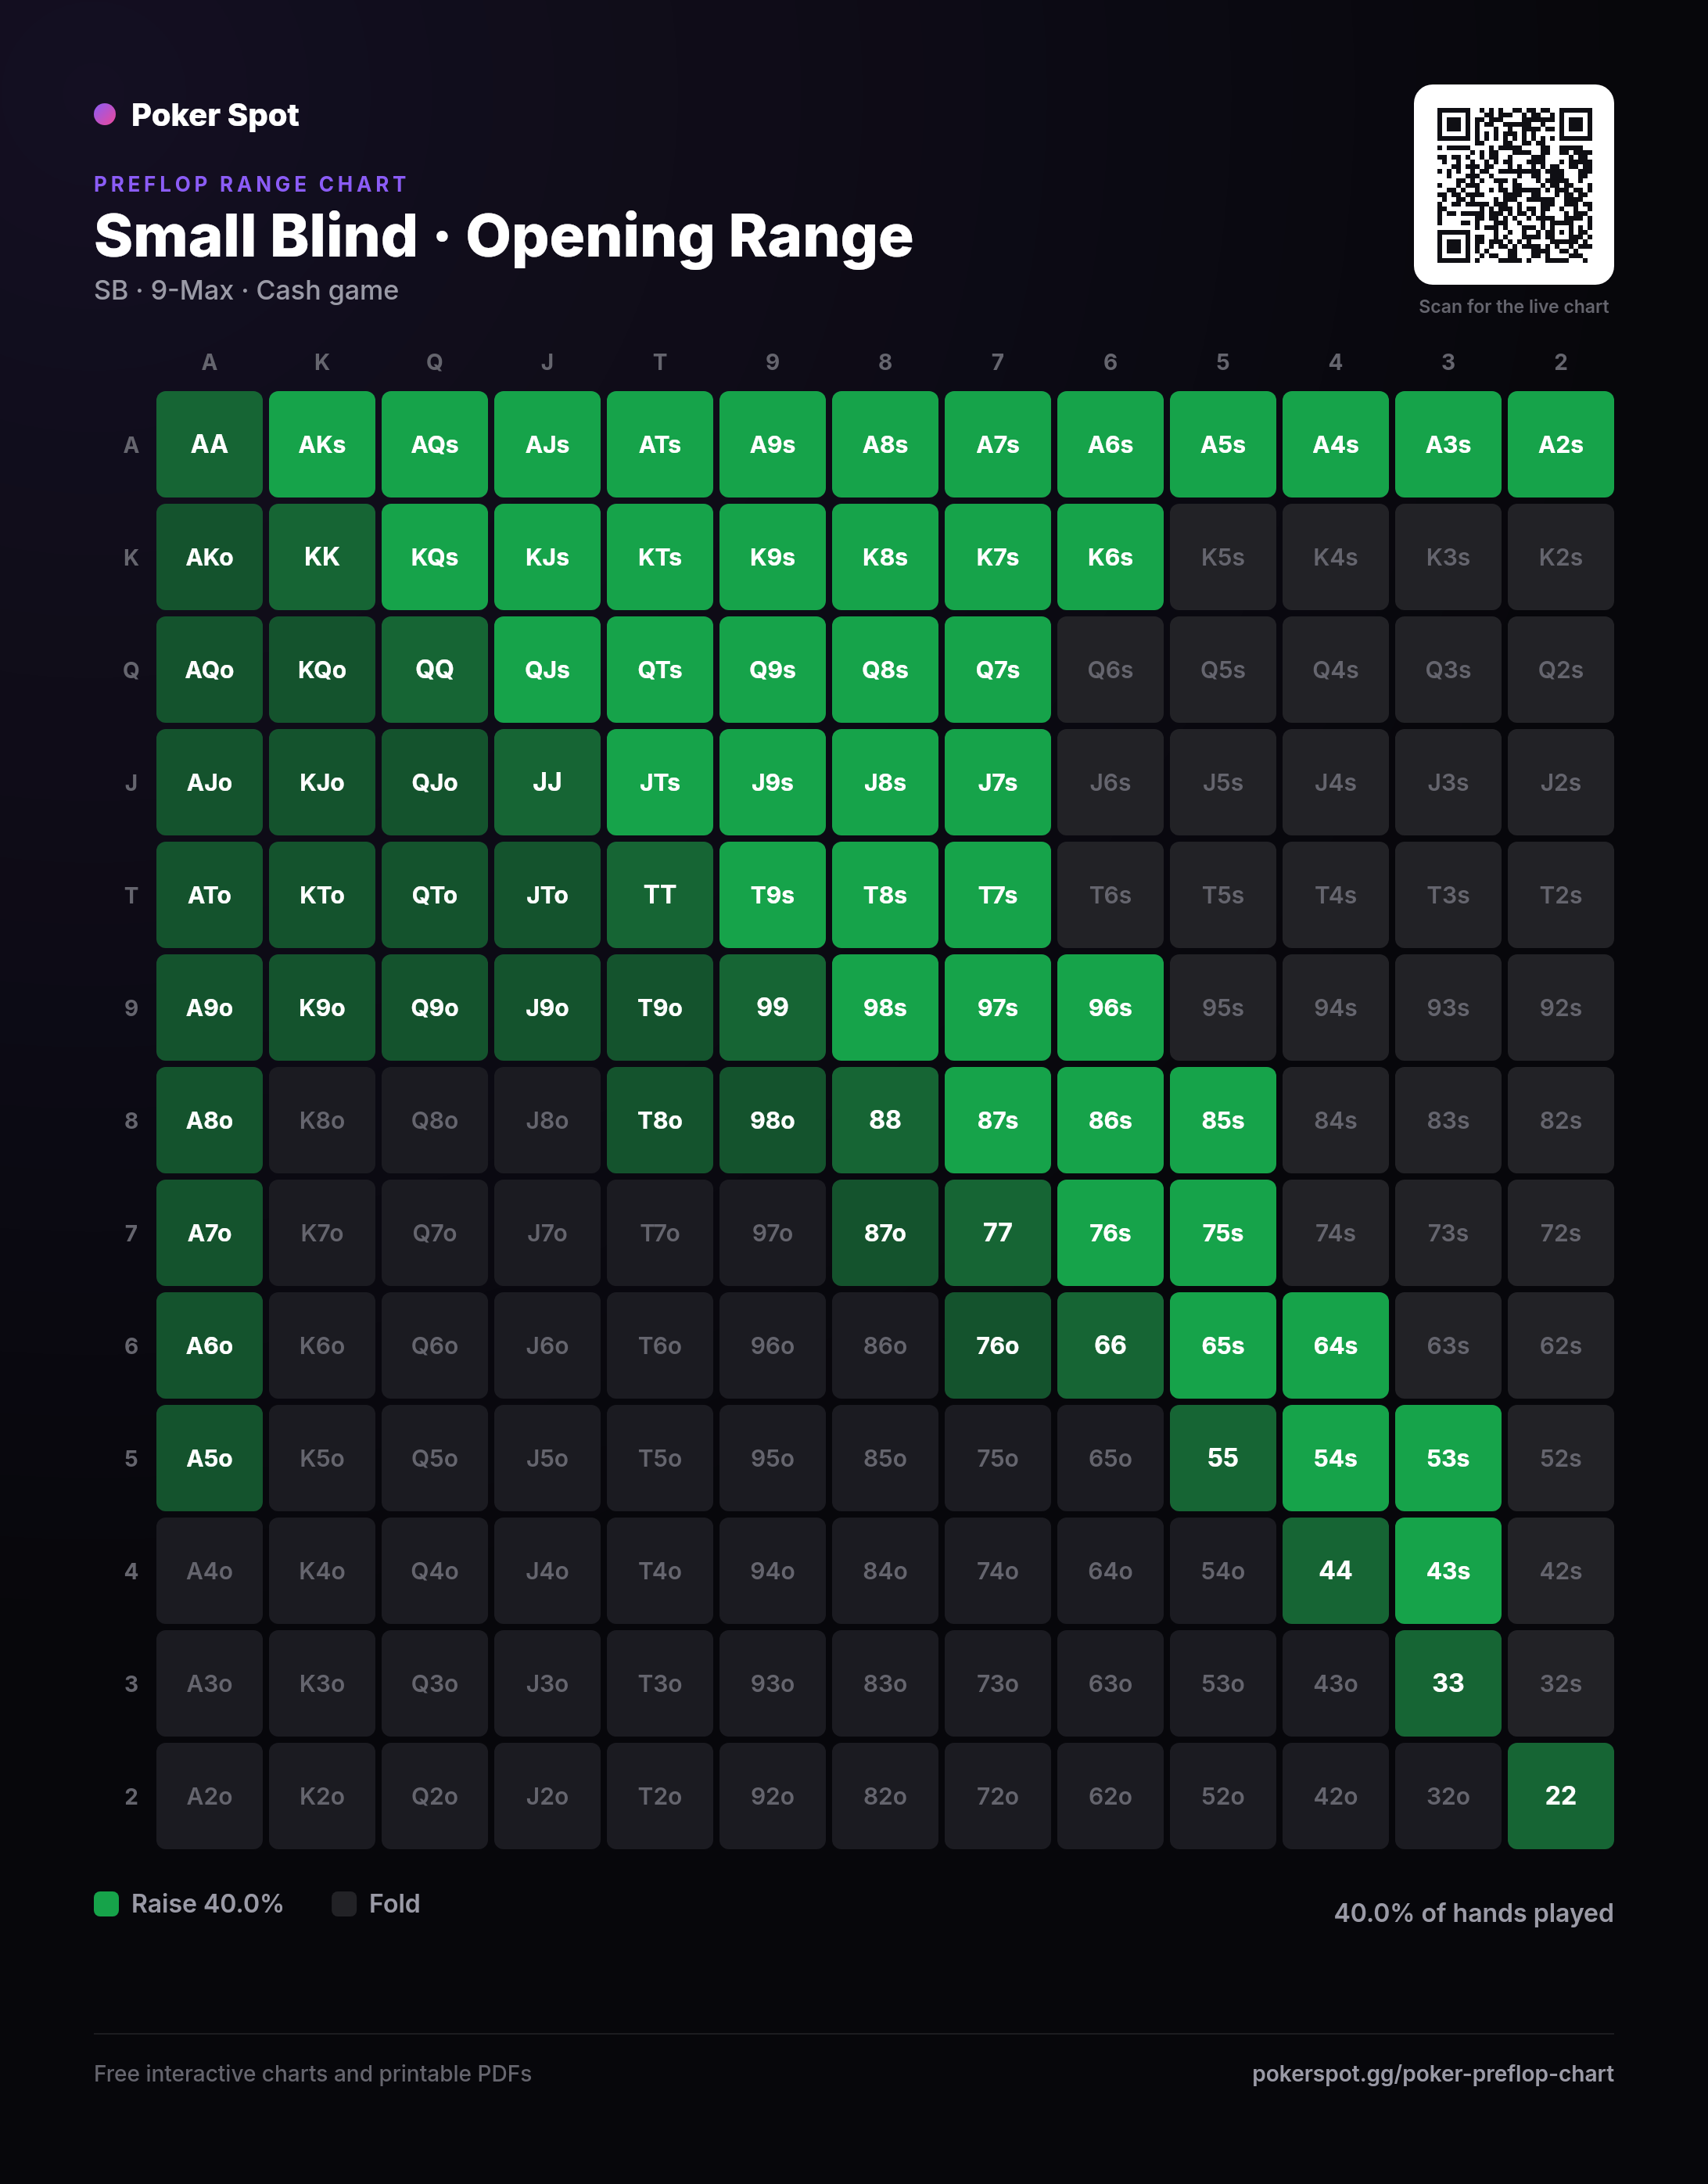
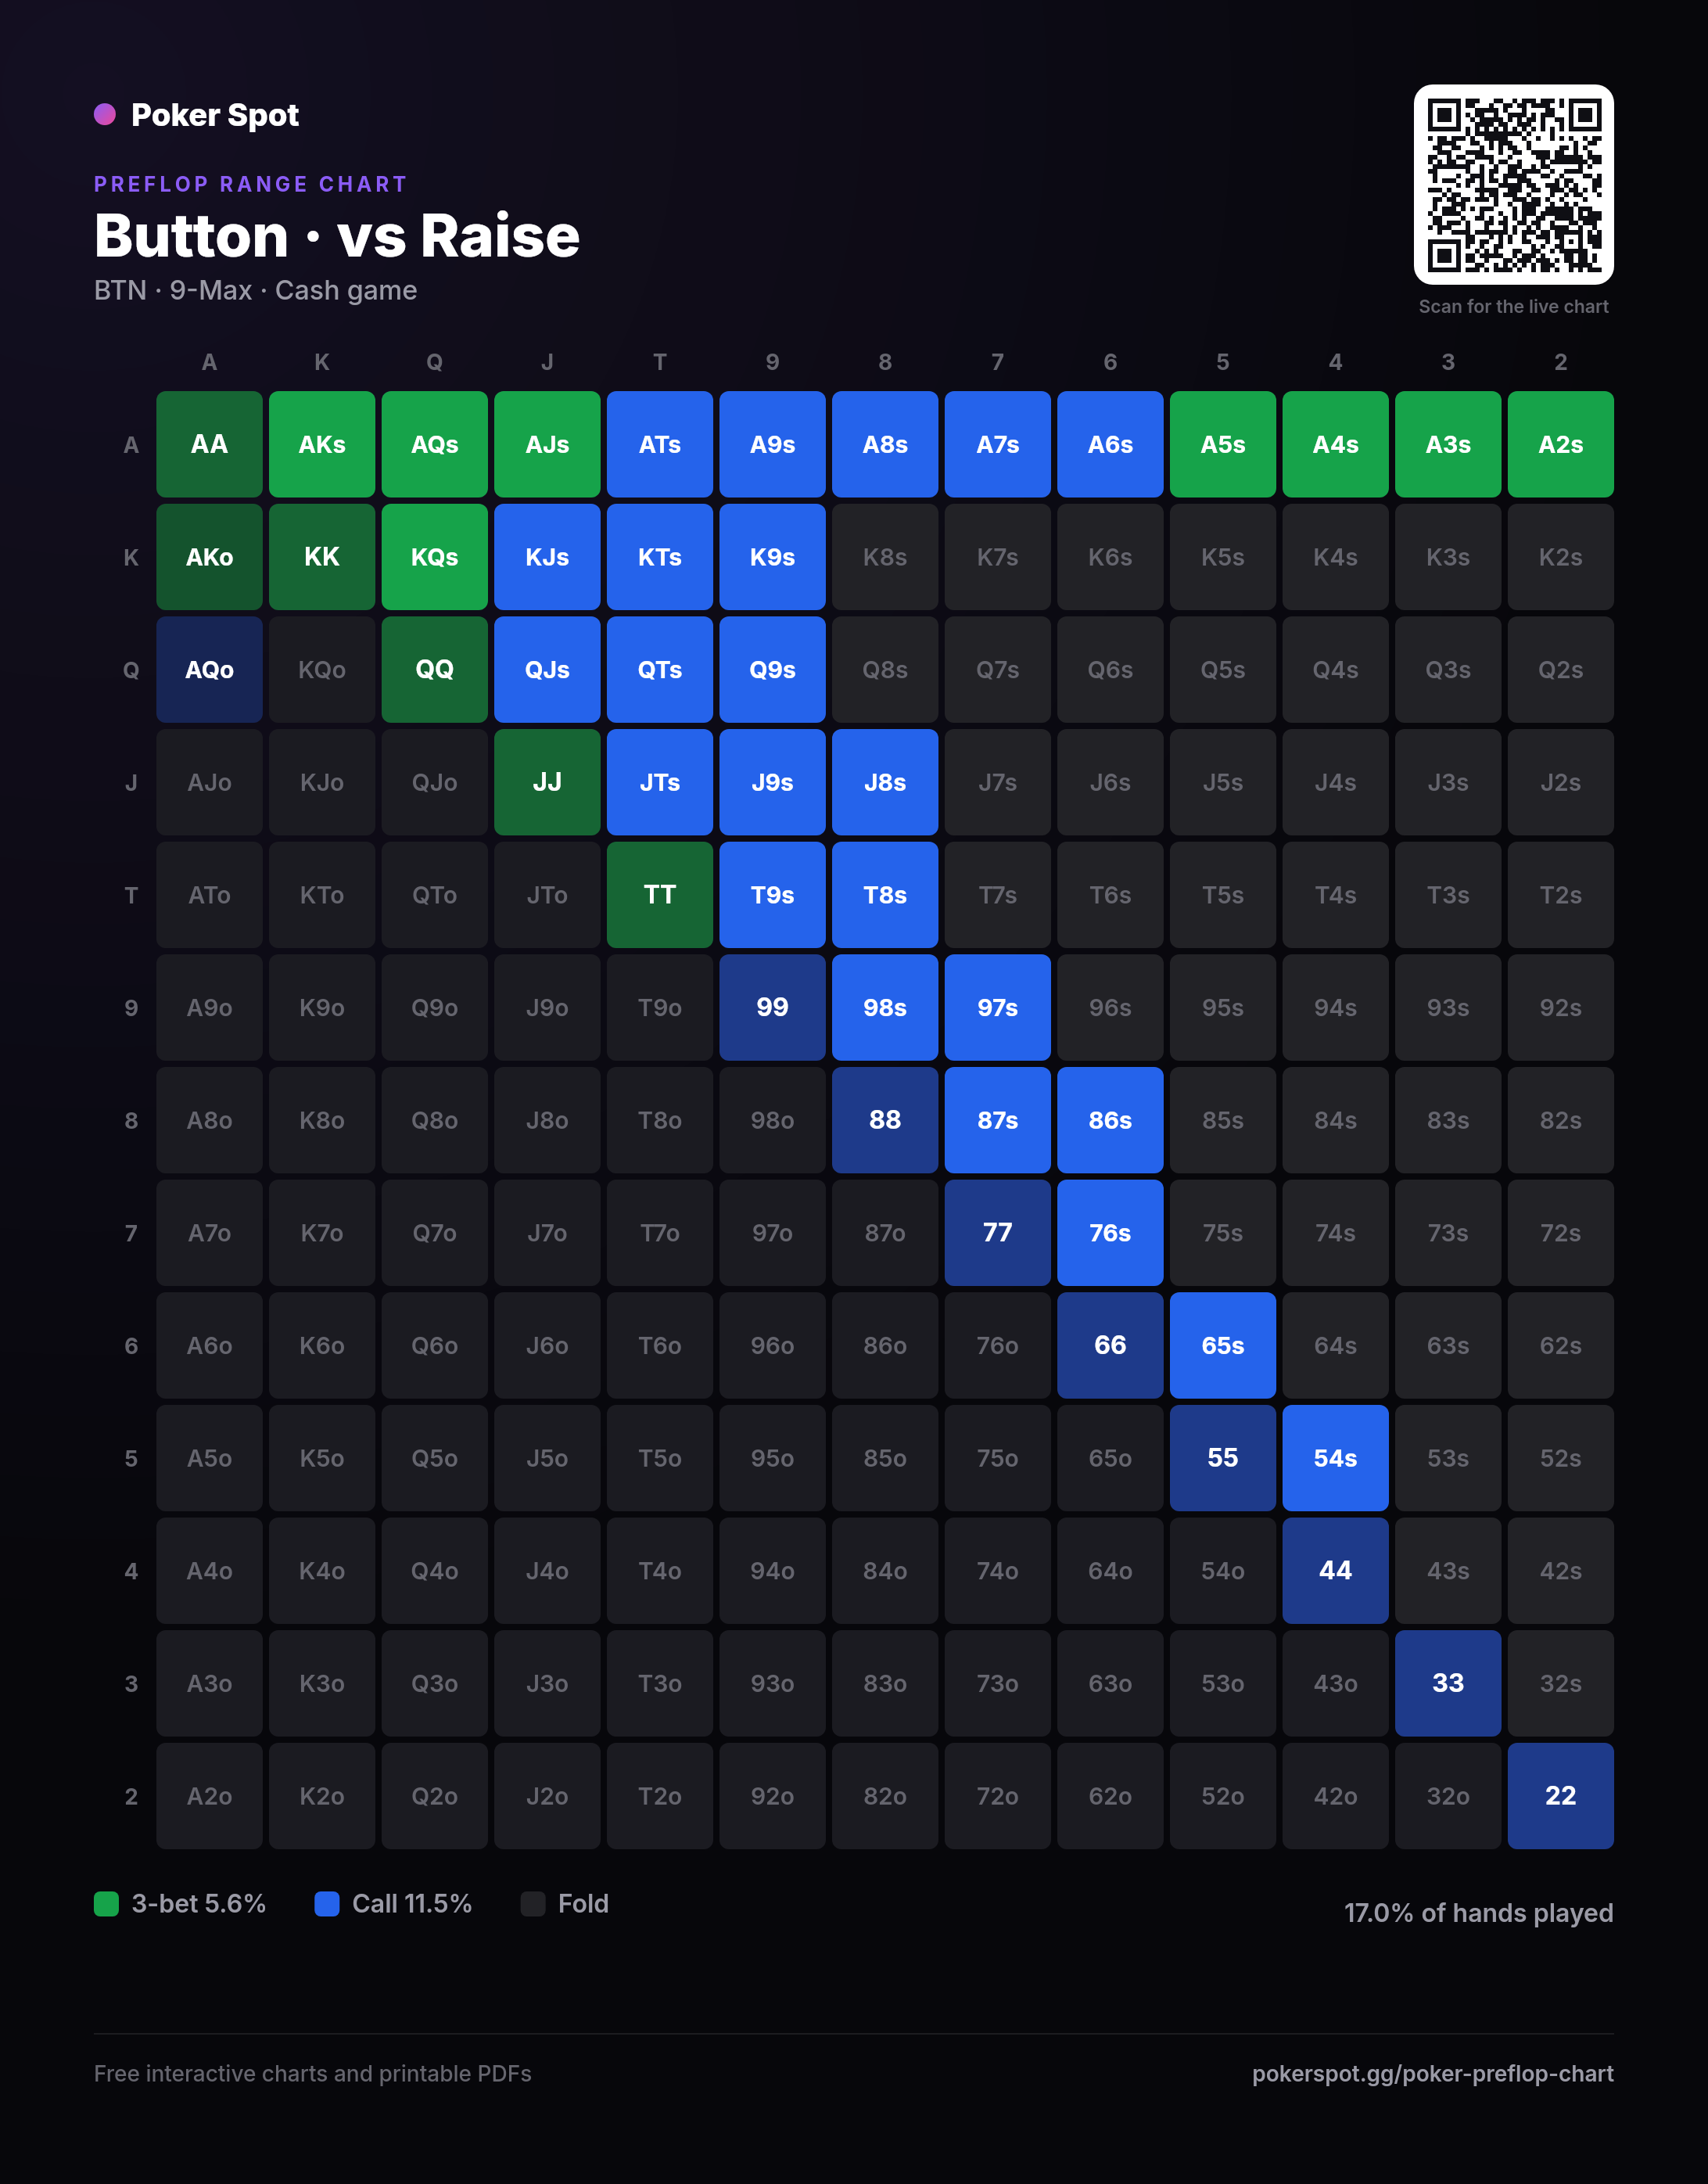
The most-used full-ring (9-max) ranges as clean, printable images. Right-click to save, or use the download link on each; scan the QR on any chart to open it live on your phone. Every seat, game type and situation, including 6-max, is available in the interactive chart above, with a download button that always matches what is on screen.
View and download all 78 charts →
How to read the grid
Every no-limit Hold'em hand collapses into one of 169 shapes. Suits only matter preflop insofar as your two cards match or do not, so A♠K♠ and A♥K♥ are the same hand for charting purposes: AKs. That is what the 13×13 grid encodes.
The squares are not equally likely. A pocket pair can be dealt 6 ways, a suited hand only 4, and an offsuit hand 12. There are three times as many ways to be dealt AKo as AKs. So the offsuit half of the grid, below the diagonal, carries most of the weight: the 78 offsuit squares are 70.6% of all hands, while the 78 suited squares are just 23.5% and the 13 pairs are 5.9%.
This is why "play suited connectors" is cheaper advice than it sounds, and why a chart that shades in a big block of offsuit hands is a much wider range than one that shades the same number of suited squares.
Why position changes everything
The single biggest driver of which hands are profitable is where you sit. Acting last means you see what everyone else does before you commit, and that information is worth more than most people's card advantage. If the seat names below are new to you, the poker positions guide explains each one on an interactive table.
Two forces push the same direction. Later position means fewer players left behind you who could wake up with a real hand, so your raise gets through more often. It also means you will be in position for the rest of the hand, which raises the value of speculative holdings that need to see cheap flops and get away cheaply when they miss.
The result is the staircase you see in the table below: from under the gun you are opening roughly one hand in nine, and on the button roughly one in two.
6-max cash opening ranges
Raise first in, meaning the pot is unopened when the action reaches you. These are the same ranges the chart above draws, written in standard notation.
| Position | Hands | Open-raising range |
|---|---|---|
| UTG | 11.2% | 77+, ATs+, A5s-A4s, KTs+, QTs+, JTs, T9s, AJo+, KQo |
| HJ | 19.0% | 55+, A2s+, K9s+, Q9s+, J9s+, T8s+, 98s, 87s, 76s, 65s, ATo+, KJo+, QJo |
| CO | 31.2% | 22+, A2s+, K7s+, Q8s+, J8s+, T7s+, 97s+, 86s+, 75s+, 64s+, 53s+, 43s, A9o+, K9o+, Q9o+, J9o+, T9o |
| BTN | 47.5% | 22+, A2s+, K2s+, Q5s+, J6s+, T6s+, 96s+, 85s+, 74s+, 63s+, 53s+, 43s, A4o+, K8o+, Q9o+, J9o+, T9o, 97o+, 86o+, 75o+, 65o |
| SB | 40.0% | 22+, A2s+, K6s+, Q7s+, J7s+, T7s+, 96s+, 85s+, 75s+, 64s+, 53s+, 43s, A5o+, K9o+, Q9o+, J9o+, T8o+, 98o, 87o, 76o |
The small blind is the odd one out. It is the second-worst seat at the table and yet it opens 40% of hands, wider than the cutoff. That is not a mistake: everyone but the big blind has already folded, so it is a heads-up pot against one random hand, and there are already dead chips in the middle. Raising to take them down immediately is worth a lot. What the small blind gives up is being out of position for the rest of the hand, which is why its range leans on suited hands and trims the weakest offsuit ones.
9-max cash opening ranges
Full ring adds three more seats in front of you, and the early ones play tighter than anything in 6-max. But notice what happens at the other end of the table.
| Position | Players behind | Hands | Open-raising range |
|---|---|---|---|
| UTG | 8 | 9.0% | 77+, ATs+, A5s, KJs+, QJs, JTs, AQo+, KQo |
| UTG+1 | 7 | 10.0% | 77+, ATs+, A5s, KJs+, QJs, JTs, AJo+, KQo |
| UTG+2 | 6 | 10.6% | 77+, ATs+, A5s-A4s, KTs+, QJs, JTs, AJo+, KQo |
| MP | 5 | 11.2% | 77+, ATs+, A5s-A4s, KTs+, QTs+, JTs, T9s, AJo+, KQo |
| HJ | 4 | 19.0% | 55+, A2s+, K9s+, Q9s+, J9s+, T8s+, 98s, 87s, 76s, 65s, ATo+, KJo+, QJo |
| CO | 3 | 31.2% | 22+, A2s+, K7s+, Q8s+, J8s+, T7s+, 97s+, 86s+, 75s+, 64s+, 53s+, 43s, A9o+, K9o+, Q9o+, J9o+, T9o |
| BTN | 2 | 47.5% | 22+, A2s+, K2s+, Q5s+, J6s+, T6s+, 96s+, 85s+, 74s+, 63s+, 53s+, 43s, A4o+, K8o+, Q9o+, J9o+, T9o, 97o+, 86o+, 75o+, 65o |
| SB | 1 | 40.0% | 22+, A2s+, K6s+, Q7s+, J7s+, T7s+, 96s+, 85s+, 75s+, 64s+, 53s+, 43s, A5o+, K9o+, Q9o+, J9o+, T8o+, 98o, 87o, 76o |
The last four rows are identical to the 6-max chart, and that is not laziness. A seat is not defined by the name on it, or by how many people sat down. It is defined by how many players still have to act behind you, because those are the only players who can wake up with a hand and punish your raise.
The 9-max cutoff has the button, small blind and big blind left to act: three players, exactly like the 6-max cutoff. The two seats face the same problem, so they get the same answer. Adding four more players to a table does not change the button's spot at all, it just means the button has to wait longer between orbits.
Line the two charts up by players behind and they interlock: 9-max MP has five players behind, the same as 6-max UTG, and the ranges match. The only genuinely new ranges in full ring are the three seats with six, seven and eight players left to act, which are tighter than anything 6-max ever asks you to play. Under the gun in a nine-handed game you are opening 9% of hands, roughly one in eleven.
The suited wheel aces
Look at the under-the-gun range and you will find A5s and A4s sitting there while A9s and A8s are folds. Hands you would call worse are in the range and hands you would call better are not. That looks like a typo and it is not.
Those hands are there as the bluffing half of the range. When you open under the gun and get 3-bet, you need some hands you can continue with that are not premiums, or you become trivially exploitable by anyone who 3-bets you relentlessly. A5s is the ideal candidate: it makes the nut flush, it makes wheel straights, and it holds an ace, which blocks a chunk of the hands that would 3-bet you. A9s makes weaker flushes, rarely makes straights, and is much easier to dominate.
This is the general shape of good preflop play. Ranges are not a ranking of hands from best to worst with a line drawn somewhere. They are built from value hands plus deliberately chosen bluffs, and the bluffs get picked for their blockers and their playability, not their raw strength.
Cash games and tournaments are not the same
Flip the Game toggle and every range tightens. In a cash game a chip is worth a chip: if a spot makes money on average, you take it, because you can always reload. In a tournament your chips are worth their share of a prize pool, and that relationship is not linear. The chips you win are worth less per chip than the chips you lose, because busting ends your equity entirely while doubling up does not double your expectation.
This is the ICM effect, and its practical consequence is that marginal spots which barely turn a profit in a cash game become losers in a tournament. The chart handles this by trimming the thinnest hands from every position and by shrinking calling ranges harder than raising ranges, since calling commits chips without the chance of winning the pot immediately.
These are approximations of full-stack play, roughly 100 big blinds deep. Short stacks change the calculus completely: under about 20 big blinds you are in push-or-fold territory, where the right chart is a shove range rather than a raising range.
Using a chart without becoming a robot
A chart is a starting point, not a script. Three things should pull you off it.
- Who is left to act. A table with two aggressive 3-bettors behind you is a reason to open tighter. A table of players who fold too much is a reason to open wider than any chart says.
- Stack depth. Speculative hands like small pairs and suited connectors need deep stacks to pay off, because their value comes from occasionally winning a very large pot. At 30 big blinds they lose much of their appeal, while big cards gain.
- What is already in the pot. Limpers, straddles and antes all change the price you are being offered and the size of the prize.
The honest use of a chart is to make your default correct so that your attention is free for the decisions that actually vary. If you have to think about whether to open K9o from under the gun, you have no attention left for the turn.
Questions
What is a preflop chart?
A preflop chart is a 13×13 grid showing every possible two-card starting hand in Texas Hold'em and what to do with each one from a given seat. Pocket pairs sit on the diagonal, suited hands above it, offsuit hands below it. Colouring in the raise, call and fold hands gives you a range at a glance.
Are these GTO charts?
They are close approximations of solver output, rounded into something you can actually memorise. True game-theory-optimal play mixes: it might raise a hand 70% of the time and fold it 30%. A chart that told you to do that would be unusable at the table, so like every practical chart these pick the majority action for each hand. Against real opponents the gap that creates is far smaller than the gap created by playing the wrong hands entirely.
How many hands should I be playing?
Across all positions in a 6-max cash game these ranges work out to roughly 30% of hands when the pot is unopened, before you account for the times someone raises in front of you. In 9-max it is lower per hand dealt, because there are more seats where you fold. If you are playing 45% of hands in every seat, your problem is not chart selection.
Why do the small blind and button open so wide?
Both are stealing. On the button only two players remain, and both have already posted money you can win. In the small blind only one player remains. Fewer opponents means a raise takes the pot down uncontested more often, and the dead money makes that outcome worth more.
Should beginners use a chart?
Yes, and it is probably the fastest single improvement available. Most losing players lose most of their money to hands they should never have played, in positions where those hands were never profitable. Fixing that requires no reads, no maths at the table, and no postflop skill.
Does this work for 8-max or heads-up?
For 8-max, use the 9-max chart and drop the earliest position. For heads-up, neither chart applies: with only two players the button opens something like 85% of hands and the correct strategy looks nothing like a full-table one.
Learning ranges beats looking them up
Reading a chart is easy. Recalling the right one under pressure, three hours into a session, is the part that takes work. That comes from repetition against the spots you personally keep getting wrong.
That is what Poker Spot is built for: the same charts live in the app, alongside a preflop trainer that deals you real spots and tells you immediately when your answer drifts from the range, plus session tracking that shows which positions are actually costing you money. Pair this with the odds calculator for the postflop half, the hand rankings if you are still learning the ladder, and how to play poker if you are just starting out. Prefer paper? Print the preflop cheat sheet and keep it beside you.